Market insight
The rising cost of imbalance in European energy markets
Settlement periods are shrinking, renewables are harder to forecast, and cross-border platforms are exposing national markets to steeper price swings. Here is what is driving imbalance costs up, where it is sharpest, and what portfolio teams are doing about it.
Fusebox · Market insight · Updated August 2026
Imbalance costs are climbing across Europe as settlement periods shrink toward 15 minutes and renewable output gets harder to forecast at scale. Portfolios that used to absorb small deviations without penalty are now priced on almost every one. Below: what is driving the increase, where it is worst right now, and how portfolio teams are starting to respond.
Why imbalance costs are rising
Three structural shifts are compounding at once: settlement windows are shrinking, renewable generation is harder to forecast at portfolio scale, and cross-border balancing platforms are exposing national markets to sharper price swings.
Shorter settlement periods, less room to average out
A growing list of markets have moved from hourly to 15-minute imbalance settlement, including the Baltic states, Greece, and, most recently, the Nordics, where Sweden completed the shift in 2025. A shorter window means the same size forecast error gets priced far more often, with less time to correct it before it becomes a charge.
Renewable forecast errors move together
Weather-driven forecast errors tend to be correlated across a portfolio rather than random. When conditions shift, many assets deviate in the same direction at once, so the resulting imbalance can be large and directional rather than small and self-cancelling — a dynamic several European traders flagged clearly after a January 2026 snow event knocked out Dutch solar output in a single direction across the board.
Cross-border integration cuts both ways
Platforms like MARI and PICASSO, which pool balancing energy across borders, have measurably compressed day-ahead-to-imbalance spreads in several markets. But joining them also exposes smaller, shallower national markets to continent-scale scarcity events — which is part of why the Baltic states have repeatedly seen prices hit the ±€10,000/MWh platform cap since joining.
Where the cost is highest right now
Germany and the UK carry the largest absolute system balancing bills in Europe. But the sharpest portfolio-level imbalance price swings — the ones that actually hit a balance responsible party’s settlement — are currently in the Netherlands, the Nordics, and the Baltics.
Imbalance cost and volatility signals by market, 2025–2026
| Market | What’s happening | Source |
|---|---|---|
| Germany | Redispatch and congestion management running €2.8–3.2bn a year, a roughly 15x increase over a decade. | Clean Energy Wire |
| United Kingdom | £2.1bn in balancing costs in 2025, up 25% year on year; £12bn cumulative since September 2021. | Nuclear Industry Association |
| Netherlands | Record imbalance price of €5,500/MWh (October 2025); structural imbalance periods roughly tripled since 2023. | COMCAM Energy |
| Nordics (Sweden) | Most volatile quarter on record after the March 2025 mFRR EAM launch, with prices exceeding €10,000/MWh. | Montel |
| Baltics | Prices repeatedly hitting the ±€10,000/MWh MARI/PICASSO cap since joining in 2024–2025, reflecting a historically shallow market. | Dexter Energy |
| Belgium | Sharpest pre-integration exposure of the markets studied — imbalance spreads fell roughly 55% after joining PICASSO. | Dexter Energy |
| South-East Europe | Still integrating: Hungary connects to MARI/PICASSO in September 2026, Croatia not until 2027 — a structurally shallower, later-wave market. | CEENERGYNEWS |
What portfolio teams can do about it
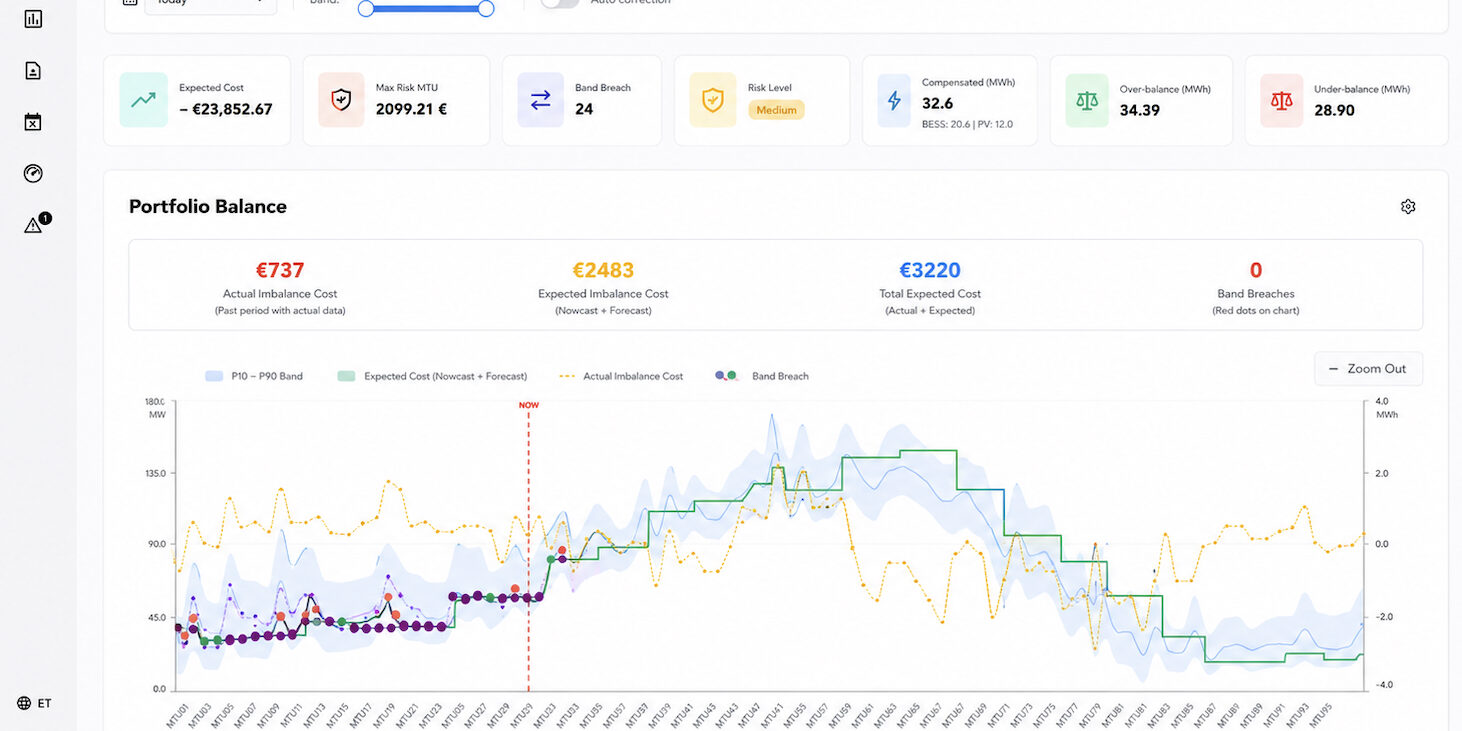
The main lever is speed: closing the gap between a portfolio’s market position and its actual production or consumption inside the settlement window, not after it has already closed. That means moving from periodic dashboard checks to continuous comparison against a live baseline, with a defined threshold for when a deviation is large enough to warrant automated or manual correction.
Introducing Fusebox Imbalance Reduction
We are building Fusebox Imbalance Reduction as a new layer on top of Fusebox’s existing portfolio aggregation and disaggregation, using the same dispatch logic already proven across ancillary markets — now applied to managing a portfolio’s own balance.
- Automated portfolio steering: set upper and lower energy thresholds and let the dispatch engine handle routine regulation.
- Precision baselining: sync market positions straight into the dispatch engine through the Portfolio Baseline API.
- Unified management: run bid and activation templates per portfolio for one consistent workflow.
Not an ancillary-market product. Imbalance Reduction does not bid into TSO markets. It works alongside any mFRR, aFRR, or FCR revenue you already earn with Fusebox, closing the gap on your own settled position rather than competing with it.
How it works
- Baseline in. Your market position or baseline schedule is provided through the Portfolio Baseline API.
- Continuous comparison. The engine tracks actual portfolio power against that baseline in real time.
- Threshold check. A deviation is measured against configurable upper and lower energy limits.
- Correction. Once a threshold is breached, the system can generate an offer automatically or route it for manual dispatch.
- Imbalance narrowed. The portfolio’s settled position moves back toward baseline before the window closes.
Figures cited above reflect publicly reported market data as of August 2026 and are not Fusebox performance claims.